

London elections are, in one way at least, like big Hollywood film productions. There is a lengthy publicity campaign, an all-star launch – although the ExCel centre is hardly a glamorous venue – and then the production is absorbed by the greater public. A few months later the average punter might remember the ending and the main stars and forget about the details.
But the serious fan awaits the Blu-Ray release, with hours of added detail about the final cut and the deleted scenes, the themes and influences, the director’s shot-by-shot analysis. The equivalent of the London Mayor election collector’s edition disk is the data drop by London Elects Results 2021 | London Elects a couple of weeks later, which has the voting numbers for each of London’s 632 wards plus the City.
For most people, a certain amount of this is interesting, but they would like to hear the short version. This, dear reader, is what I will try to do here, having lost myself in the intricacies for a few days.
The majority of London boroughs have fairly fixed political preferences – seven have voted on first preferences for a Conservative Mayor every time since 2004, while twelve have been consistently Labour. The only two which have consistently swung with the tide and voted for the winner each time have been Merton and Wandsworth.
The Conservatives won three otherwise Labour boroughs at their high point in 2008 – Greenwich, Hounslow and Redbridge – while Labour’s peak performances have had a more varied profile. Ken Livingstone carried Croydon, Harrow, Kingston and Richmond in 2004, and Sadiq Khan won Enfield in 2016 but not in 2021. In compensation, Khan won two boroughs in 2021 which had been Tory every time since 2004 – Hammersmith & Fulham and, more surprisingly, Westminster. He also “gained” the City of London relative to 2016, although it had also voted Labour in 2004.

After second preferences, the leading candidate changed in three boroughs – in Enfield, Kingston and Richmond Khan overtook Tory candidate Shaun Bailey in the final count. The latter two results were a return to the strong Livingstone Labour results in 2004 which had been washed away by the “doughnut strategy” of the Conservative campaign in 2008 and Boris Johnson’s relative acceptability to the liberal suburbs. Khan’s strength was reflected both in the first preference vote – he gained the support of many people who support the Liberal Democrats for other contests – and in the second preferences, where he attracted Greens and Lib Dems.

Khan’s victory was built on similar foundations to London’s majority for Remain in the 2016 EU referendum: it was no accident that his most impressive results were in boroughs like Hammersmith & Fulham, Wandsworth and Westminster which had voted Remain by significant margins but turned in Conservative majorities in the 2016 mayoral election that preceded it. The traditional patterns of voting have not been completely overturned: strongly Leave Barking & Dagenham is still Labour and pro-Remain Kensington & Chelsea still Conservative, although with dented majorities in both cases.

Looking at the map in more fine-grained detail, in two boroughs – Havering and Sutton – the Conservatives won every ward, nearly all by comfortable margins. The boot was on the other foot in eight all-Labour boroughs – Hackney, Haringey, Islington, Lambeth, Newham, Southwark, Tower Hamlets and most surprisingly Camden- and in the City. The Conservatives only carried one ward in Wandsworth in the second round, but can point to their success in conquering old-style Labour outer areas such as New Addington and Harold Hill, and even picking off a lone ward in all-Labour Newham (Custom House) on the first preference count.
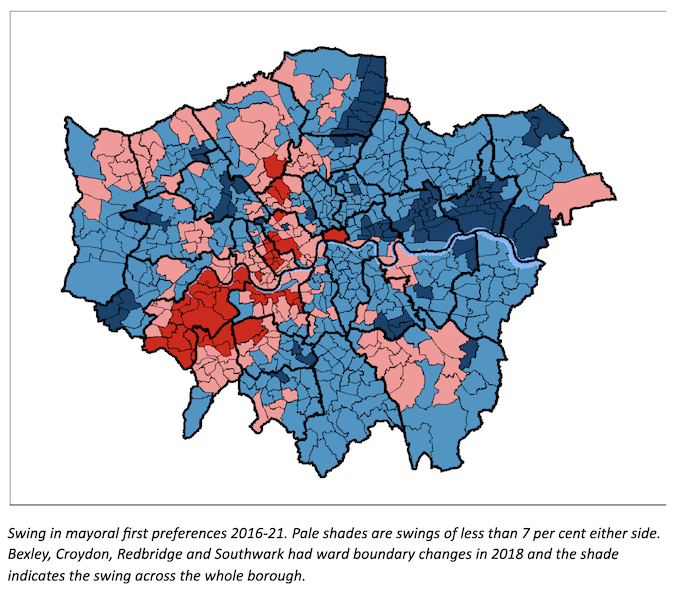
The swing by ward since the 2016 mayoral contest was astonishingly variable. The biggest swing (on first preferences) to Conservative was in the Little Ilford ward of Newham (19.2 per cent), and the biggest to Labour was in South Richmond (17.1 per cent). When there is a spread this big between elections with a similar overall result, it is a sign that the tectonic plates have moved.
Swing is a simple measure that sums up some complex phenomena: the swing to Conservative in some wards is exaggerated by voters using their first preference for other candidates but returning to Khan on the second preference count. Another factor increasing the pro-Bailey swing is the lower turnout among young and ethnic minority voters than in 2016, which reduces the Labour lead without the Conservative vote having risen.
But it is undeniable that Bailey achieved some impressive results in previously barren territory. The best Conservative swings were in a band of territory from Stepney to Rainham and from Tottenham to Enfield Lock, and there were clear patches of pro-Tory swing in other working-class white and diverse areas in outer London, including many “council estate” areas – St Helier, Downham and Thamesmead, for instance.
Even in Inner London, the Tory counter-swing in Labour-swinging territory came in relatively deprived areas – Church Street and Queens Park in Westminster, Stonebridge in Brent, Latchmere and Roehampton in Wandsworth. Labour’s best swings were in a band of territory west and south of the City, out to Surbiton and Hampton, and in a few highly affluent suburban areas – Pinner, Beckenham and Cheam.
Khan also improved his position in several wards with significant Jewish communities: Garden Suburb and Golders Green in Barnet, and neighbouring areas in Camden. This reflected his efforts at building relations with London’s Jews and the change in Labour’s national leadership. Khan was less successful with London’s Hindus, with a further adverse swing on top of bad results in 2016 in Harrow and Brent, particularly around Kenton.
Curiously, the swing map is pretty much the inverse of what happened between 2008 and 2012, when Johnson gained support in the south west and centre – running Labour close even in Camden – while Livingstone picked up particularly well along the Lea Valley and in working class outer London. Perhaps there are categories of people who grow to like or dislike mayors, whatever their party or personality, after one term of office?
For a little bit of fun, I thought I might try a different way of slicing up London politically – one I don’t think has been done before. I grouped all the wards in London by their TfL zone and worked out the Mayor and Assembly results, and the result is less the famous “doughnut” than a cinnamon swirl.
The battlegrounds are Zone 1 – containing plush central residential areas such as Knightsbridge but also some social housing in places such as King’s Cross and Southwark – and Zone 4, which includes many of the town centres that have long been absorbed into London, for example Ilford, Southall and Richmond. Zones 2 and 3, where the London identity is strongest, voted heavily for Khan while Zones 5 and 6 – which include suburbs that shade into Kent, Surrey and Essex – were strongly for Bailey.
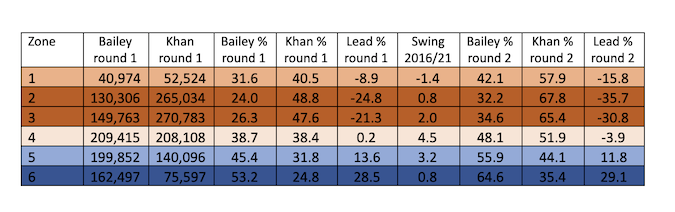
The “swirl” idea of London voting behaviour shows several significant patterns. The highly Conservative outer ring extends only part way into Zone 5, a relatively thin layer of Conservative dominance in the suburbs before one reaches competitive territory. These are the most car-oriented places, where the traditional Conservative campaigning points about motoring are best-received and worries about Bailey’s phantom “outer London tax” meant most.
These arguments seem to have extended inwards along some roads – the faster bits of the A13 and the A10 stand out. The swing to the Conservatives was actually highest in the halfway out areas of London – the diverse suburban territory between the car-driving outer ring and the metropolitan heart of Inner London where the Conservatives were very weak. The centre of the swirl at Zone 1, covering the wealthiest areas of Britain (and a few of the most deprived) but where relatively few voters live, voted more strongly Labour than in 2016. but it is still significantly more Tory than the layers just outside it on the Tube map.
Voters seem in a more experimental mood when they vote for Mayor than for the London Assembly. Sadiq Khan was a lightning-rod for groups that were disgruntled with Labour, such as Harrow Hindus and Dagenham working-class whites, polling well below Labour’s Assembly candidates. But he was also more attractive to Richmond liberals and Wandsworth bankers, who stuck with the Lib Dems or Tories at Assembly level. Khan polled double the Labour Londonwide list vote in Richmond, but only 78 per cent of the Labour list vote in Barking & Dagenham.
Bailey’s best results relative to the Tory list – around half as many votes again – were in some deprived wards of Tower Hamlets and Southwark (although getting 1.5 times the baseline Tory vote in these areas is still not a lot of votes). There was nowhere Bailey fell hugely behind the Conservative list vote, and his vote had a more orthodox distribution than Khan’s.
These variations, and the overall comfortable but not overwhelming Labour lead across London, resulted in Labour Assembly candidates winning rather more wards than the Mayor. There were 14 Conservative-Khan wards, but 46 that voted Labour for Assembly constituency and Bailey for Mayor. Some of this reflects the greater fragmentation of the centre-left vote on the first round (Khan “gained” 30 wards on the second count), but also the wide variation of Khan’s vote either side of the Assembly baseline.

Sian Berry of the Greens polled best in Dalston in Hackney, and Luisa Porritt of the Lib Dems had her relative stronghold in Berrylands, Kingston. You Tuber Niko Omilana, who finished fifth, polled over 5 per cent in 18 wards, mostly diverse and youthful areas, and Count Binface fared best in Crystal Palace (Bromley) and the City of London. Brian Rose’s frankly baffling campaign was best received in Forest Gate North (Newham).
There are endless details to be mined out of these elections, and I may be playing with these tables for some time. Did you know, for instance, that the loudly anti-elitist Laurence Fox polled more than 5 per cent in only two wards – which happened to be the most elite enclaves anywhere in Britain, namely Royal Hospital in Chelsea and Knightsbridge & Belgravia in Westminster?
The results offer a few pointers to the borough council elections due less than a year from now. Labour must cast an anxious eye over Harrow, which some in the party worried would be lost in 2018 and looks difficult to defend in 2022 on these numbers. Voting in Croydon suggests a potential challenge – Labour lead in enough wards to retain control, but need to avoid leaking votes to the Greens. Hammersmith & Fulham should be less of a worry than Enfield.
The Lib Dems are in good shape in Kingston and Richmond. The Conservatives should be approaching the election in Barnet with renewed confidence and would need to slip back further to worry about Westminster because of advantageous ward boundaries and the concentration of the Labour vote in the north west of the borough.
The most imperilled Tory council is undoubtedly Wandsworth, where Labour dominated in the 2021 elections and now has all three MPs. It would be big news if this fortress fell after 44 years of continuous Conservative control. Take your seats, please, for the London elections of May 2022.
On London is a small but influential website which strives to provide more of the kind of journalism the capital city needs. It depends on financial help from readers and is able to offer them something in return. Please consider becoming a supporter. Details here.
This is fascinating stuff, but as far as I can see the ward-level data only covers people who cast their vote at polling stations. All the postal votes in each borough are lumped together. Would you expect the voting patterns to be different if the postal votes were also listed by ward?
Thanks for the question. The analysis here takes postal votes into account; they are allocated to each ward proportionately according to a formula based on the votes cast at polling stations. It isn’t perfect, but it is unlikely to be far off – and it’s better than using the totals without postal votes which gives a misleading impression of the overall votes cast.
Intersesting and thoughtful article.