
London is often described as rich, decried as a “playground for the rich” and denounced for receiving more than its fair share of tax payer riches in the form of public investment. But how rich is the average Londoner?
There are several ways of defining wealth. People can own expensive property yet also have low incomes, as London illustrates particularly well. Conversely, Londoners can be earning good money yet be unable to buy a home in the capital and struggle to make ends meet. Pay rates in London tend to be higher than elsewhere in the UK, but the cost of living in London is higher too.
All of the above should be kept in mind when considering the figures presented below. Even so, those figures help place the “rich London” narrative in context.
The first set is from the Office for National Statistics (ONS) annual survey of hours and earnings (ASHE), which uses a sample of full-time jobs paid at adult rates taken from HMRC records. Available from the London Datastore, they show what people living in London’s 33 local authority areas (as opposed to working in them but living elsewhere) are paid.
The figures pictured below are from the data showing the amounts paid each week. The last column shown on the right gives you the 2016 median figure for each London local authority. As you can (just about) see, figures from previous years and for other UK nations and English regions are shown too.
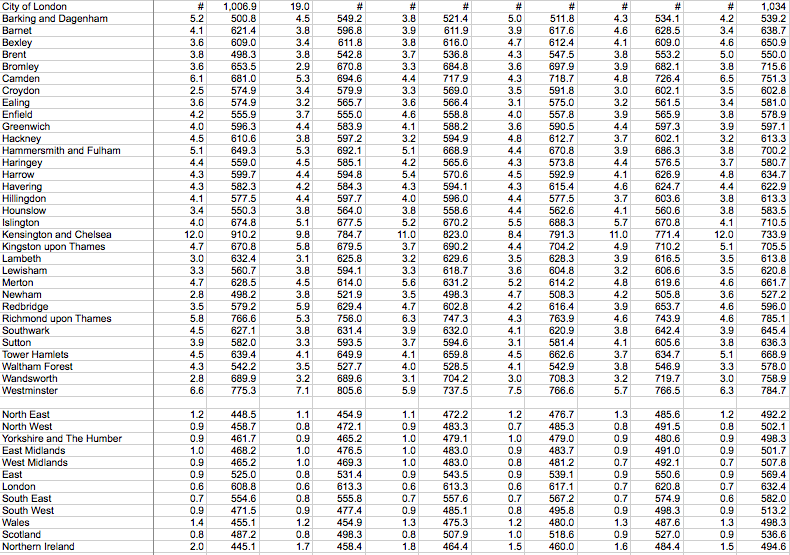
Importantly, ASHE prefers to highlight the median rather than the mean figure, because the former is less skewed by the small number of very high earners individual boroughs may contain. The median is considered a more accurate measure of what is typical.
It won’t be a surprise that the highest weekly pay rate, at over £1,000 a week, is paid to residents of the City of London (of whom there are relatively few). You might be a bit surprised to find suburban Richmond upon Thames in second place on £785,100 a week – I was, but given that many well-paid City workers commute from there, maybe I should not have been. Westminster comes third (£784,700 p/w), Wandsworth fourth (£758,900 p/w) and Camden fifth (£751,300 p/w).
At the other end of the scale, the people of Newham have the lowest median wages at £527,200 a week. Counting up from the bottom, they are followed by those of Barking and Dagenham (£539,200), Brent (£550 p/w), Waltham Forest (£578 p/w), and Haringey (£580,7000 p/w). The media for Greater London as a whole is £632,500 p/w – about £33,000 a year.
Each of these borough medians will conceal substantial variations, of course. What is often forgotten when people attack “rich London” is that the capital contains some of the highest poverty rates in the whole of the UK and many people who are paid less than is judged adequate for a decent standard of living in London – about 40% of them, according to recent research.
Other ONS figures held in the London Datastore show the percentages of people on low incomes resident in each local authority between 2008 and 2015 – specifically, those earning less than the London Living Wage and less than the lower National Minimum Wage over that period. Call them up and you’ll see that for the Living Wage the figure for Greater London as a whole went up from 18% to 27% during those seven years. For the Minimum Wage it rose from 6% to 10%. A lot of new jobs have been created, but too many are poorly paid.
These figures give an indication of how hard the very poorest Londoners have been hit in recent years and merit a separate article another time. For now, readers wishing to dig deeper into what Londoners are paid are recommended to go the the London Datastore, open “jobs and economy” and search “income”.