

On Wednesday morning Transport for London’s programmes and investment committee will meet at the Palestra building on Blackfriars Road to consider, among other things, putting a further £211 million into its “healthy streets” programme in order to bring up to £737.8 million its estimated cost for the financial years 2020/21 to 2024/25. The 21-page paper supporting this request is full of interesting arguments and figures about buses, bicycles and walking. They illustrate TfL’s approach to changing how London’s roads and streets are used, and also help to crystalise questions about the effectiveness of certain policies.
A section headed “looking to the future” sets out the case for “reducing car use and increasing travel by sustainable modes”. Paragraphs dedicated to cycling say that “nearly half of car journeys currently made by Londoners [are] cyclable in around ten minutes, rising to two-thirds under 20 minutes” and that because “concerns over road danger and fear of collisions remain the primary barrier to taking up cycling” it is “imperative that we continue to deliver a safe protected cycle network at pace”. The climate crisis, road congestion and poor air quality are listed as challenges London faces that more cycling would help the city address.
This is a further restatement of the case that has been made for redesigning roads to gave cyclists their own portion of road space since the launch of Boris Johnson’s Vision for Cycling almost ten years ago. Yet there are no figures or survey data in the healthy streets report for 1 March to show that the special infrastructure added to London’s roads since then has resulted in Londoners making journeys by bicycle they would have previously made by car. Can it be shown that bicycle lanes reduce car use? TfL has told On London its data team have no figures about people switching to cycling from driving or indeed any other transport mode.
Interestingly the healthy streets report says that cycling has become safer over the past 20 years – since more than ten years before the publication of Johnson’s 2013 Vision document – with a “nearly 50 per cent drop in the risk of being killed or seriously injured” during that time. Can we therefore be certain that redesigning road space over the past ten years has contributed to a downward trend in deaths and serious injuries that began ten years earlier? And given that 20-year trend, can we be sure that the concerns about safety expressed in survey responses are proportionate and not unduly influenced by media coverage of cycling casualties and cycling safety campaigns?
An issue not addressed at all in the healthy streets report is the very narrow section of London’s population that chooses to ride bicycles. TfL and City Hall are very aware that affluent white men are statistically over-represented in London’s cycling demographic and that female, low-income and non-white Londoners are under-represented (see graph from TfL’s most recent Travel in London report below).

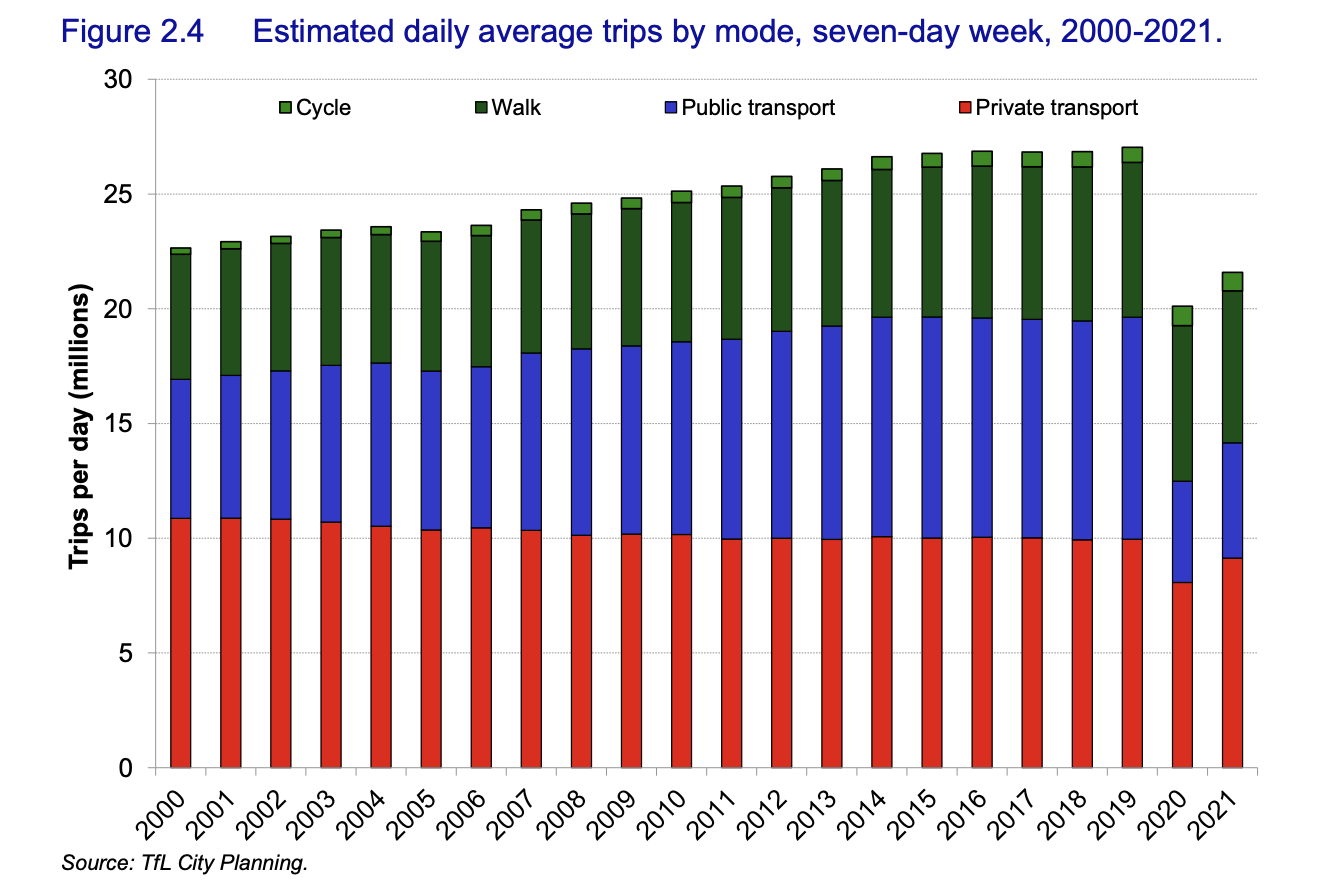
That under-representation is a reason why the overall cycling population of London has remained very small throughout this century (see Travel in London report graph below). Plainly, if a wider variety of Londoners wanted to ride bicycles instead of travelling by other means that overall number would go up. Do those responsible for TfL’s healthy streets programme have a view about why certain groups of Londoners are less attracted by cycling than others and what might be done to enthuse them?
The healthy streets report also confirms that buses, far more than bicycles, are the transport mode of choice for Londoners on low incomes. “More than one third of bus journeys are made by Londoners with an annual household income of less than £20,000,” it says. Also: “Buses carry more people than any other mode (aside from walking) on central London’s streets and more than six million bus journeys are made on a typical day, representing around one in five of all journeys made in the capital”.
The report points out that “buses use our streets more efficiently than cars, accounting for 16 per cent of the road space used but 67 per cent of the movement of people on the carriageway”. However, it does not point out that buses also use street space more efficiently than bicycles. Some argue that the allocation of dedicated space to cycling has contributed to bus journeys taking longer than they used to. The healthy streets report does not go into that debate.
Finally, the healthy streets report provides a little insight into a separate matter – the amount of control national government continues to exert over TfL, which is in theory an autonomous public authority to which power over the running of London’s transport networks has been devolved. The government funding agreed last August came with a requirement that “on average £80 million each year” would be “ringfenced” for “active travel”. The days of Whitehall knows best are over, proclaimed the Conservative Party’s 2019 election manifesto. Over, that is, except when they aren’t.
This article was updated on 1 March 2023 to include the fact that TfL’s data team has no information about people switching to cycling from other modes.
On London strives to provide more of the kind of journalism the capital city needs. Become a supporter for just £5 a month. You will even get things for your money. Learn more here.
Looking at the chart my reading is that over the past decade the overall percentage of those cycling at least once a week has fallen – albeit marginally. Within that fall the percentage of asian cyclists has doubled while that of black cyclists has halved. That of those earning under £20,000 has halved while that of those earning more than £75,000 has doubled. That of those aged under 45 has fallen while that of those aged over 65 has doubled. Is that evidence of a divisive and failed policy? Or am I missing something.
“affluent white men are statistically over-represented in London’s cycling demographic and that female, low-income and non-white Londoners are under-represented”. Such a scandal that hundreds of millions are still being lavished on this tiny wealthy section of the travelling public.