

“Gentrification” is always front and centre of debates about the impact on east London of the London 2012 Olympic and Paralympic Games. Legacy sceptics claim the “regeneration” of the Lower Lea Valley has resulted only in long-established working-class communities being driven out of their own neighbourhoods by more affluent incomers. Its champions take a different view, pointing to new amenities, a better environment, more jobs and homes, and rising educational attainment.
Yet Census and other data suggest that neither of these sharply opposed positions reflects the complex realities of rapid demographic and social change in this part of the capital.
To declare my interest, I worked on the project – mainly the “legacy” elements of the Queen Elizabeth Olympic Park, as it was renamed – from around 2004 to 2014. What interested me at the time was the idea of the project achieving the “regeneration of the area for the direct benefit of everyone that lives there”, in the wording of the aims agreed between the government, the Mayor of London and the event organisers.
Some commentators consider that promise to have been comprehensively betrayed. They argue that Park facilities have done nothing for local communities, with homes, workplaces and leisure centres being built for middle-class newcomers, while accelerating the displacement and victimisation of locals.
But there is a potentially positive story to be told too. In 2009, the four boroughs around the Olympic Park – Tower Hamlets, Newham, Waltham Forest and Hackney, plus Greenwich and, at a later stage Barking & Dagenham, set out a plan for “convergence”. Their aim was that on a range of indicators – from school attainment to employment to crime – these six “growth boroughs” would stop underperforming the London average.
Achieving this deceptively modest-sounding goal would be a big deal. It would involve disrupting patterns of migration that have operated for decades, if not centuries. As successive waves of new arrivals have moved into east London, its population has changed. But when newcomers prospered, they tended to move on and out, often further east, meaning that patterns of disadvantage persisted. East London saw displacement, but without gentrification.
Could this be reversed? Could the area around the Olympic Park experience a more inclusive process of change that enabled local people to stay and succeed – “gentrification from within”, as I glibly termed it when working for the London Legacy Development Corporation (LLDC)?
There has certainly been change. As OnLondon has previously reported, many of the 2020 convergence targets were met well ahead of schedule. Surprisingly, beyond saying the Growth Borough Partnership was “put into hibernation” in 2018, the website is quiet about this progress. This is unusual, as it is normally when targets are likely to be missed that they are quietly dropped by government bodies, rather that when they are on course to being achieved.
Perhaps one reason “convergence” has been sidelined is that it is too blunt-edged a metric, measured at too wide a scale. Lower unemployment, for example, could be achieved by displacing and replacing communities, instead of by helping them flourish. Nor does convergence distinguish between the impact of the London 2012 Games and other grand projects, including the London Overground extension and the completion of Crossrail, let alone wider socio-economic changes such as the impact of austerity across London.
The 2021 Census makes a more granular exploration of change possible. It has flaws, not least because it took place when many Londoners were temporarily out of town as a result of the pandemic. Furthermore, the data only captures aggregate rather than individual outcomes, and does not look back to 2001-11, when anticipation of and preparations for the 2012 Games were already having an impact. However, datasets comparing the 2021 results with those from 2011 do allow us to look in a greater level of detail at how the area round the Olympic Park has changed (the comparison datasets are collected here).
What follows first looks at the extent of population change around the Queen Elizabeth Olympic Park and then explores what we can infer about the components of that change – and specifically whether it represents a displacement of or an addition to existing communities. The “Olympic Park and Fringe” is defined by the following “middle-layer super output areas” (census tracts with a population of 2,000-6,000 people):

*Not included in some comparisons as no 2011 data available.
A decade of population growth and churn
The sheer pace of population change is striking. Between 2011 and 2021, London’s population grew by around eight per cent (though many inner London areas saw a fall, largely attributable to the temporary impact of the pandemic). Growth in the Olympic Park and Fringe was around 25 per cent, concentrated in Bromley-by-Bow and Fish Island to the west (34 and 36 per cent), in Stratford New Town and Carpenters, and in Mills Meads to the east and south (71 and 73 per cent).
The Census figures only show net change – the combined impact of myriad arrivals and departures over a ten-year period. Another data source, the Residential Mobility Index, which draws on sources such as electoral registers and land registry, estimates population “churn” – the proportion of households that have changed over a period of time. For the average London borough, around 50 per cent of households changed between 2011 and 2023. Hackney and Newham saw similar levels, while Tower Hamlets had a 76 per cent change and Waltham Forest a 43 per cent change.
But the areas immediately around the Olympic Park experienced more dramatic change, with over 90 per cent churn around Fish Island, East Village and Carpenters. Perhaps this should not be surprising, given the comprehensive redevelopment of these areas during and since the 2012 Games. As you move further east in Waltham Forest and Newham, and further west in Hackney, the degree of churn falls quite sharply: areas such as Leytonstone, Maryland, West Ham, Clapton Park and Homerton saw churn at or below the London average. Tower Hamlets is a notable exception: there was extensive population churn across the borough, with rates of 70 per cent or more all along Mile End Road and even higher around Whitechapel and Bethnal Green.
So, population growth has been intense in the immediate hinterland of the Olympic Park, though not that much higher than in other “regeneration” areas, such as Elephant and Castle, Kings Cross and Wembley. However, both growth and churn have been much more limited as you move further away from the park.
Qualifications and occupations
The harder question to answer is whether population growth and churn represent a replacement of or an addition to existing communities, in particular a displacement of working-class people and communities by more middle-class ones. Census data doesn’t really address class, but we can try to paint a picture using some proxy indicators, and by looking at the actual changes in numbers of people with particular characteristics, rather than the change in the mix. Has growth in one community been accompanied by another becoming smaller, both in itself and in comparison to trends across London?
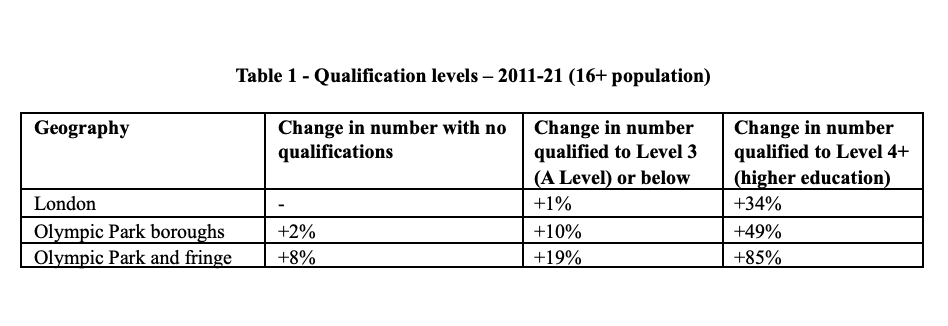
The first proxy indicator is qualification levels. The past decade has seen a rapid increase in the proportion of Londoners who have degrees or other higher education qualifications. This has risen from 38 to 47 per cent of the 16+ population across the city, and from 34 to 49 per cent in the Olympic Park and Fringe. The number of higher-qualified residents in these areas increased by 85 per cent and doubled around Stratford High Street, Stratford Town Centre, Bromley-by-Bow and Fish Island.
However the number of people without any qualifications has also increased, suggesting that in this case the change has been one of addition rather than substitution. Even if low-qualified people have moved out, other low-qualified people have moved in. The exceptions are the areas to the west of the Park – Bow, Fish Island, Hackney Wick and Hackney Marshes – where the number of low qualified people has fallen over time, suggesting a more permanent displacement.
A similar analysis has been undertaken by Duncan Smith at CityGeographics, looking at changes in occupational mix. He finds that the Lower (and Upper) Lea Valley has been at the forefront of change: the proportion of workers in managerial, professional and associate professional jobs in Waltham Forest rose from 40 to 51 per cent between 2011 and 2021, the most rapid change in England, and in Newham from 32 to 42 per cent. Analysis of numbers rather than proportions is not available by borough, but across London the number of people working in lower status occupations has not changed, suggesting that changes are additional not substitutional.
Housing tenure
Housing is another proxy: do tenure changes indicate gentrification and displacement? The Olympic Park and Fringe bucks London trends on housing tenure, with a sharp rise in owner-occupation (mortgaged and owned outright) particularly concentrated in Mill Meads, Stratford New Town and Carpenters, Bow and Fish Island, where new construction has been intense. So far, so gentrifying.
However, perhaps counter-intuitively, the number of households in social rented accommodation has also grown in the Olympic Park and Fringe, and at a faster than the London or local borough average. If social tenants around the Park have been displaced – and estate redevelopment projects in locations such as the Carpenters Estate have been highly controversial – they have also been replaced with more social tenants. Meanwhile, private renting has grown as it has across London. It is now the most widespread tenure in the Olympic Park and Fringe.

Ethnic diversity and employment
Another lens for examining change in and around the Olympic Park is ethnicity, which has a strong overlap with poverty and intersects with class disadvantage. The areas around the Olympic Park have always been some of London’s most diverse, with a non-white population of around 57 per cent in 2021, compared to 46 per cent across the capital.
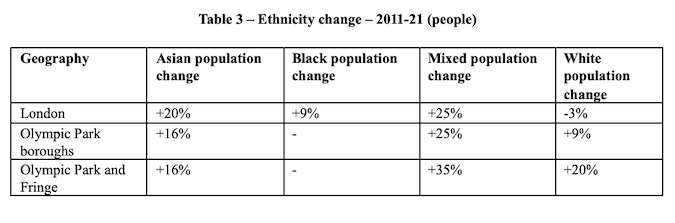
As the table below shows, compared to London as a whole the Olympic Park boroughs and the Olympic Park and Fringe areas saw faster growth in their white and mixed-race populations, slightly slower growth in their Asian population and almost no net change in their black population. Black and Asian populations fell in Waltham Forest’s fringe areas, and all populations grew fastest in Tower Hamlets’ fringes, along Stratford High Street and into the Town Centre. This suggests that even if rapid growth in white and mixed-race populations around the Park did not actually lead directly to displacement of people from Asian and black populations, it may have constrained growth in those populations to lower levels than in other parts of London.
Another perspective on ethnicity can be seen in employment rates. In the Olympic Park boroughs these rose from 59 to 62 per cent of people aged 16+ over the decade, bringing them above the London average. The rise has been sharper still in the Olympic Park and Fringe, with rates rising from 60 to 65 per cent of the population. But, while employment rates have improved for all groups relative to the London average, employment has risen fastest for white people, while it changed much less for black and Asian people, widening the employment gap between these communities.

Unfinished evolution
Taken together, these figures suggest that the London 2012 programme has had varying and complex impacts on the local area. While there have been some signs of displacement of existing populations, particularly to the west where legacy has butted up against “Hoxtonisation”, the more widespread pattern seems to have been one of densification enabling the arrival of new and different communities. These demographic changes, along with the programmes run by the Olympic Park boroughs and LLDC, have driven convergence in employment rates, in tenure, and in occupational and educational profile.
That said, the differences in improvement in employment rates, alongside recent depressing news about falling life expectancy, suggests that structural disadvantage continues to hit some east London communities hard. Twenty years after London was awarded the Games and as the boroughs, the Mayor of London and the LLDC develop inclusive economy plans, London 2012’s legacy is an unfinished evolution.
OnLondon.co.uk provides unique coverage of the capital’s politics, development and culture. Support it and its writers for just £5 a month or £50 a year and get things for your money too. Details HERE.